Clustered profiles
What are clustered profiles?
In the optimisation process, machine-learning-generated clustered profiles are used to improve performance. These profiles are created by grouping similar daily patterns from all hourly input data in Sympheny, including energy demand, on-site resources, and hourly tariffs. A reduced number of representative days (typical days) is selected, but the model still operates in hourly time steps, so variations within each day are preserved. The clustered profiles let Sympheny reconstruct the full annual profile from these representative days.
Note
These profiles remain consistent across all solutions within a given scenario. Clustering is performed for each stage, meaning all profiles used in a stage are clustered together.
How are typical days generated?
The Sympheny engine selects a specific number of typical days based on the overall hourly profiles provided and the chosen temporal resolution. These typical days are selected from the 365 possible days in a year, based on patterns identified across the combined profiles.
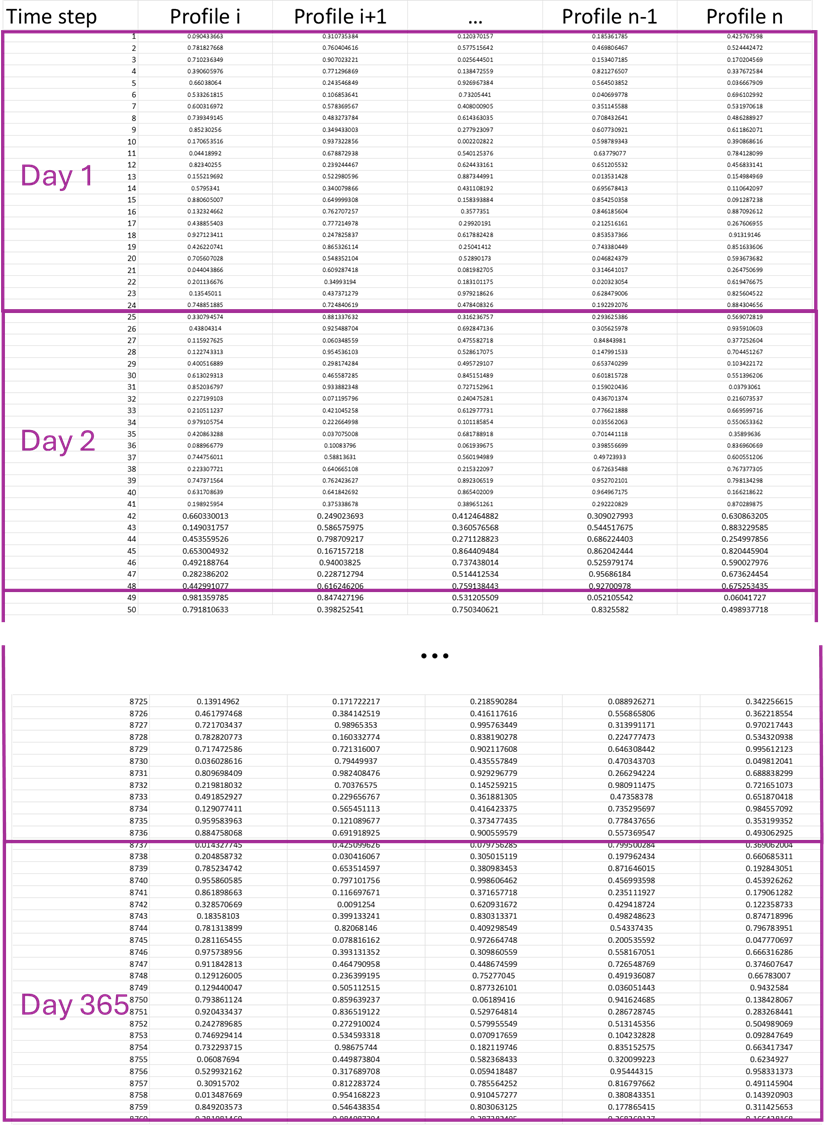
The clustered profiles are created from the selected typical days, which are repeated throughout the year. For instance, if 20 typical days are chosen, each of these days, comprising 24 hours, is used to represent the entire year, filling in the 365 days.
Each typical day is linked to specific data across all profiles, so the original days are not mixed and matched. A typical day consistently represents the same day across all profiles, rather than different days for different profiles. Each typical day consists of 24 hours multiplied by the number of profiles.
For example, in a system with two demand profiles (heating and electricity), if a typical day represents days 5, 8, 12, 23, 36, and 45 for the heating profile, it also represents those same days for the electricity profile.
Temporal resolution
The number of typical days selected is determined by the temporal resolution chosen in the execution step.
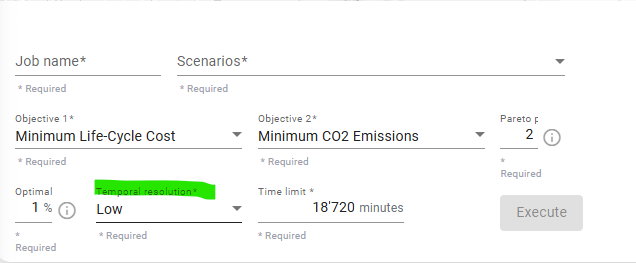
The following settings define three resolution levels, each specifying the range of typical days allowed and the corresponding error limits for load duration and total sum:
- Low:
- Minimum days: 5
- Maximum days: 50
- Max load duration error: 15%
- Max sum error: 2%
- Medium:
- Minimum days: 15
- Maximum days: 100
- Max load duration error: 7.5%
- Max sum error: 1%
- High:
- Minimum days: 30
- Maximum days: 200
- Max load duration error: 3%
- Max sum error: 0.5%
The clustering process preserves the non-zero maximum and minimum values of each profile and maintains the linear combination of the profiles: the peaks of two or more profiles occurring at the same time step are conserved.
Clustered profiles metrics
The clustered profiles exhibit a similar load duration curve to the original profiles,
while ensuring both the sum and peaks of the profiles are preserved. In the results
folder, the Output.xlsx file, which you can download once the optimisation is
complete, contains a sheet titled Clustered Profiles-[Scenario Name].xlsx with the
following metrics:
- Number of typical time steps: the total number of time steps, calculated as 24 × typical days.
- Max load duration error (%): the maximum load duration error across all profiles.
- Max sum error (%): the maximum sum error across all profiles.
The error function used to calculate these metrics is the symmetric mean absolute percentage error (SMAPE) for each profile, from which the maximum error percentage is derived.